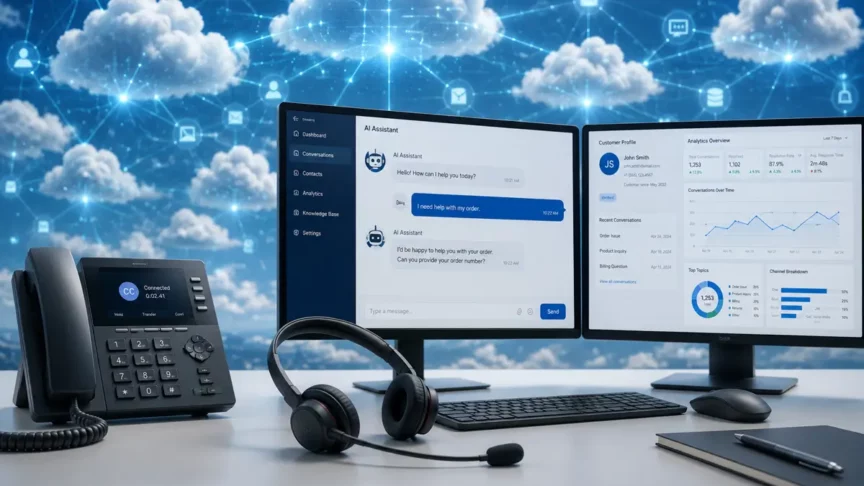
Contact centers have never had more data, or more ways to get lost in it. Leaders can track hundreds of contact center metrics across the customer journey. The challenge isn’t collecting data – it’s knowing which contact center KPIs actually matter.
When dashboards become crowded with disconnected measurements, leaders fall into KPI overload. Individually, these numbers may be useful, but together, it’s often unclear which metrics are driving performance and why.
The better approach is to start by asking: What are we trying to improve? When contact center metrics are organized around business goals, they become a decision-making framework instead of a collection of disconnected reports.
This article breaks down the contact center metrics leaders should track across customer experience, operational efficiency, agent productivity, AI and self-service effectiveness, quality and compliance, and executive visibility.
That’s a lot. But we break down each section to show the metrics that matter, why leaders track them, how they’re calculated, and how they can be used in reporting.
Customer Experience Metrics: Are Customers Getting the Help They Need?
These contact center metrics help leaders understand how well the contact center delivers experiences that drive satisfaction, loyalty, and retention.
| Metric | Question It Answers | Why Leaders Track It | How It’s Calculated | How to Use It in Reports |
| CSAT (Customer Satisfaction) | Are customers happy with the service they receive? | Tracks perceived service quality. | (Satisfied survey responses ÷ Total survey responses) × 100 | Trend by month, channel, queue, and team; compare with FCR and Customer Effort. |
| First Contact Resolution (FCR) | Are we solving problems during the first interaction? | Shows whether customers need repeat contact. | (Issues resolved on first contact ÷ Total issues) × 100 | Compare with repeat contacts, escalations, and CSAT. |
| Escalation Rate | How often do issues require additional support? | Reveals process, training, or knowledge gaps. | (Escalated interactions ÷ Total interactions) × 100 | Report by queue, issue type, and channel. |
| Customer Effort | How easy is it for customers to get help? | Identifies customer friction. | Measured through a survey, using an average or percentage of low-effort responses. | Review with transfers, wait times, and FCR. |
Operational Efficiency Metrics: Are We Delivering Service Efficiently?
Operational efficiency metrics help leaders understand how effectively the contact center uses resources while maintaining service quality.
| Metric | Question It Answers | Why Leaders Track It | How It’s Calculated | How to Use It in Reports |
| Average Handle Time (AHT) | How efficiently are customer interactions being handled? | Identifies process and workflow inefficiencies. | (Talk time + Hold time + After-call work) ÷ Total handled interactions | Compare with CSAT and FCR to avoid efficiency-only decisions. |
| Average Speed of Answer (ASA) | How long are customers waiting before they reach an agent? | Shows whether staffing matches demand. | Total wait time for answered interactions ÷ Total answered interactions | Monitor by queue, channel, and time of day. |
| Abandonment Rate | How many customers give up before receiving assistance? | Reveals wait-time and delay impact. | (Abandoned interactions ÷ Total incoming interactions) × 100 | Compare with ASA and queue volume. |
| Queue Health | Can our current staffing and resources keep up with demand? | Shows service-level stability. | Determined using queue length, backlog, wait time, service level attainment, and agent capacity. | Use to monitor backlog, capacity risk, and workload imbalance. |
Agent Productivity Metrics: Are Agents Able to Work Effectively?
Productive agents aren’t just busy; they resolve issues consistently while maintaining quality and customer experience.
| Metric | Question It Answers | Why Leaders Track It | How It’s Calculated | How to Use It in Reports |
| Occupancy | Are agents spending time effectively? | Balances workload and staffing. | ((Interaction handling time + After-call work time) ÷ Total available agent time) × 100 | Track by team, shift, and queue to flag workload pressure. |
| After-Call Work (ACW) | How much time goes to post-interaction tasks? | Shows administrative burden. | Total after-call work time ÷ Total handled interactions | Monitor by type, team, and queue to find automation or process gaps. |
| Transfer Rate | Are agents resolving without transfers? | Reveals training or routing gaps. | (Transferred interactions ÷ Total handled interactions) × 100 | Compare by queue, team, channel, and issue category. |
| Resolution Rate | How often are issues resolved? | Measures customer outcomes. | (Resolved cases or interactions ÷ Total cases or interactions) × 100 | Review with FCR, CSAT, QA scores, and escalation rates. |
AI and Self-Service Metrics: Where Is Automation Supporting the Service Model?
Many organizations measure AI success by adoption or usage. A more useful approach is to understand where automation supports the service model, where self-service resolves work, and where customers still need agent support.
| Metric | Question It Answers | Why Leaders Track It | How It’s Calculated | How to Use It in Reports |
| Containment Rate | How often does automation resolve issues? | Shows successful automated resolution. | (Interactions resolved without live-agent support ÷ Total automated interactions) × 100 | Trend with CSAT and escalations to confirm successful self-service. |
| Deflection Rate | How many requests are prevented by self-service? | Shows whether customers find answers independently. | (Self-service resolutions or avoided contacts ÷ Total potential support requests) × 100 | Measure impact on contact volume, staffing, and live-agent workload. |
| Bot Escalation Rate | How often does AI still need human support? | Highlights automation gaps. | (Bot interactions escalated to an agent ÷ Total bot interactions) × 100 | Identify workflows, intents, topics, or knowledge gaps that need improvement. |
| AI Suggestion Acceptance | Do agents use AI recommendations? | Measures AI usefulness. | (AI suggestions accepted by agents ÷ Total AI suggestions presented) × 100 | Use low acceptance to improve grounding, context, or relevance. |
Quality and Compliance Metrics: Are We Delivering Consistent, Compliant Service?
Effective contact center quality management requires more than monitoring service levels. Organizations need visibility into interaction quality, compliance risks, coaching needs, and customer outcomes.
| Metric | Question It Answers | Why Leaders Track It | How It’s Calculated | How to Use It in Reports |
| QA Scores | Are agents following service standards? | Measures service quality. | Total points earned on QA evaluations ÷ Total possible QA points × 100 | Trend by queue, team, cohort, and interaction type. |
| Customer Sentiment | How are customers reacting? | Reveals recurring concerns. | Calculated using sentiment analysis or customer feedback scoring across interactions. | Monitor by type, channel, issue, and journey stage. |
| Compliance Issues | Are agents following required policies? | Identifies compliance risk. | Number of issues, or (Interactions with issues ÷ Total reviewed interactions) × 100 | Use exception reporting to flag high-risk areas and training needs. |
| Coaching Opportunities | Where do agents need support? | Supports continuous improvement. | Number or percentage of reviewed interactions flagged for coaching. | Track over time to measure coaching and training impact. |
Executive Visibility Metrics: Can Leadership Quickly Understand Contact Center Performance?
Executives don’t need every KPI. They need dashboards that highlight outcomes, trends, risks, and opportunities.
| Metric Category | Question It Answers | Why Leaders Track It | How It’s Measured | How to Use It in Reports |
| Customer Experience Metrics | Is service meeting expectations? | Tracks satisfaction and resolution quality. | CSAT, FCR, Customer Effort, and Escalation Rate trends. | Show monthly or quarterly customer experience trends. |
| Operational Health Metrics | Can we keep up with demand? | Shows capacity and service stability. | ASA, Abandonment Rate, Queue Health, and volume trends. | Highlight capacity risks and service pressure. |
| Productivity and Workforce Metrics | Are teams working effectively? | Measures workforce effectiveness. | Occupancy, ACW, Transfer Rate, and Resolution Rate trends. | Show utilization, workload, resolution, and admin burden. |
| AI and Self-Service Metrics | Where is automation part of the service model? | Provides context for AI and self-service activity. | Containment, Deflection, Bot Escalation, and AI Suggestion Acceptance trends. | Show where self-service is handling work, where agent support is still needed, and which service areas need refinement. |
| Quality and Risk Metrics | Are quality and compliance controlled? | Monitors quality and risk exposure. | QA, Sentiment, Compliance, and Coaching trends. | Identify risk areas and performance priorities. |
Connecting Metrics and Business Outcomes
Identifying the right contact center metrics is only part of the equation. Organizations also need the right tools to connect customer, operational, workforce, quality, and AI data so contact center reporting leads to better decisions. The right technology helps turn contact center analytics into actionable insights through a unified contact center dashboard.
| Microsoft Solution | Primary Benefit |
| Dynamics 365 Contact Center | Captures and manages customer interactions across voice, digital channels, queues, and routing. |
| Dynamics 365 Customer Service | Manages cases, resolutions, escalations, service workflows, and customer history. |
| Microsoft Power Platform | Connects and extends service data across business systems, including Dataverse, Power Automate, and Power Apps. |
| Power BI | Turns governed data into dashboards and trend reporting for company-specific performance visibility. |
| Copilot in Dynamics 365 Customer Service and Copilot Studio | Supports AI-assisted service and self-service experiences that can be included in automation reporting. |
In a connected reporting environment, these solutions work together to move information from daily activity to performance visibility:
- Dynamics 365 Contact Center captures interaction activity across channels, queues, and routing.
- Dynamics 365 Customer Service connects those interactions to cases, resolutions, escalations, and customer history.
- Microsoft Power Platform captures and connects service-related details that may not live in Dynamics 365 Customer Service, such as approvals, follow-up tasks, internal forms, billing details, or data from other business systems.
- Power BI turns that data into dashboards that show the company’s actual service performance across teams, channels, issues, and time periods.
- Copilot in Dynamics 365 Customer Service and Copilot Studio generates service and self-service data that can be included in dashboards to show which issues are resolved through automation, which are escalated to agents, and where self-service may need better answers or routing.
Have More Questions About Contact Center Strategy?
This article focuses on the contact center metrics leaders should use to measure performance, reporting, and business outcomes. For broader questions about contact center strategy, technology, implementation, and service modernization, see the following resources:
- What is Contact Center as a Service? explains how CCaaS can improve contact center operations and support better customer satisfaction.
- Contact Center Modernization: A Practical Guide for Service Leaders provides step-by-step guidance for building a more connected contact center foundation.
- Multichannel vs. Omnichannel Contact Centers explains how customers connect with service teams and why the difference matters for your service model.
- Why Contact Center CRM Integration Matters shows how integration brings customer history, interaction details, case information, and preferences into a single view.
- Dynamics 365 Contact Center FAQs answers common CCaaS questions for leaders evaluating Dynamics 365 Contact Center.
- AI-Driven Contact Center Optimization Workshop provides a tailored assessment of your contact center and the direction needed to elevate your service operation.
Improve Contact Center Reporting with JourneyTeam
The most successful contact centers track the right metrics – and each should answer a specific business question. By aligning contact center reporting with outcomes, you can make better decisions, improve service delivery, support agents more effectively, and maximize the value of every customer interaction.
If your team is struggling to turn contact center data into actionable insights, JourneyTeam can help you build a modern contact center reporting foundation and connect the right metrics to the right business outcomes so leaders can clearly see what’s working, where service is falling short, and what to improve next.
Reach out today and let’s start a conversation.